We truly appreciate all your participation this past spring in conducting bee surveys using the Smartphone app Survey tool. We gathered substantial data and learned a great deal about how to make the app even better for next year’s apple bloom.
Here at NEPP Headquarters we are busy analyzing all of your Spring survey data. Our participant summary shows that across 262 data entries we have data on approximately 30 orchards. These data points are spread across 4 states including 10 counties in NY, 2 counties in Connecticut and 1 county each in Maine and Massachusetts. The majority of users were orchard growers, researchers and teacher/students followed by orchard consultants and cooperative extension. Each user took data between 2 and 10 times. This is significant considering this was our first season. (See Summary Table)
NEPP Survey App Summary Table 2016
Summary of User Data
| # of data points | 262 | |
| # of Orchards | ~30 | |
| # of counties in NY | 10 | |
| # of counties total | 14 | |
| # of States | 4 | (NY, MA, CT, ME) |
User Type (Total # of Users = 22)
| # backyard-naturalist | 1 |
| # commercial orchard grower | 5 |
| # orchard consultant | 2 |
| # cornell cooperative extension | 2 |
| # researcher | 8 |
| # teacher-or-student | 4 |
Orchard Type (Total # of Data Points = 260)
| conventional | 95 |
| IPM | 157 |
| organic | 7 |
| backyard-garden | 1 |
Average # of bees per orchard type
| wild bees | honey bees | |
| conventional | 2.5 | 6.0 |
| IPM | 3.9 | 5.7 |
| backyard-garden | 6.0 | 10.0 |
| organic | 2.3 | 3.7 |
Your data shows that early bloom began between May 9th and 12th. And peak bloom ranged from the 17th to the 22nd of May. Compared to our historical data this was 2-4 days shorter than other years. This is not surprising considering sub-lethal damage caused by the April freeze in many areas.
As hoped, we see meaningful trends in regards to the effects of management technique and temperature on wild bee species vs honey bee abundance. IPM management techniques are significantly correlated with increased wild bee abundance across sites (Figure 1).
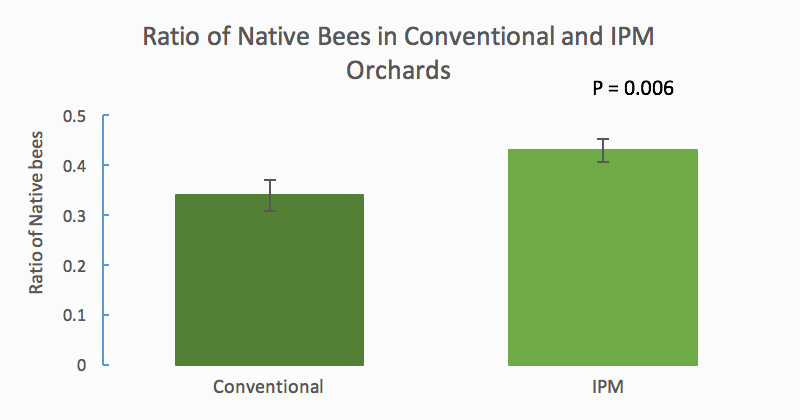
Figure 1. Comparing native bee abundances across IPM and Conventionally managed orchards.
As for bee foraging response to temperature, both honey bees and wild bees show increasing abundance with increasing temperatures. We see a slight tendency for honey bees to be a bit more dependent on warmer temperatures than the wild bee population (Figure 2).
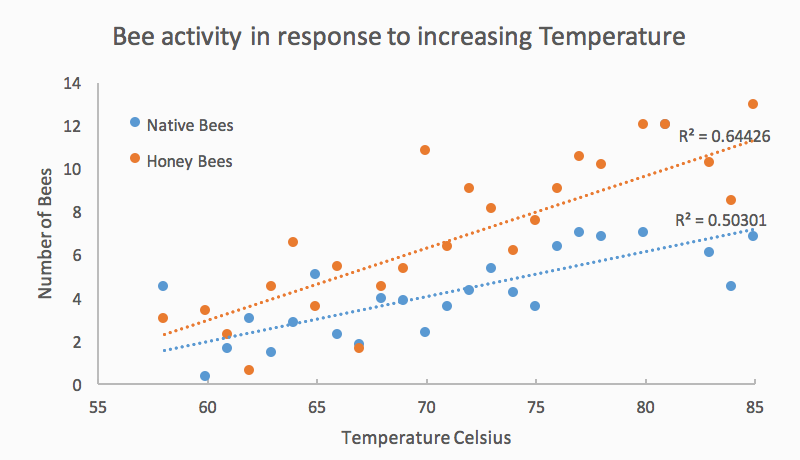
Figure 2. How do native and honey bees respond to changing temperature?
For sites that we have previously sampled using standardized aerial netting, the wild bee abundance data looks comparable. As we dig further in to the data we will be looking at how your bee populations correlate with surrounding landscape and eventually be able make some regional and individual predictions about the ability of your wild native bee populations to provide full and efficient pollination.
It was very exciting for us that our app detected a 2016 trend showing increased honey bee abundance on specific sites we have been monitoring for several years. We learned that many growers had rented extra honey bees this season in order to compensate for the damage done to the apple blossoms during the April freeze. Orchard growers find that even if the bud damage is very low, apple blossoms can die more quickly when affected by a hard frost. Therefore, orchards that DO NOT normally rent honey bees, rented honey bees this year and orchards that normally DO rent honey bees rented even more hives than usual to ensure that they would get pollinated quickly if blossoms did not last more than a day or two. Being able to compare historical data with our 2016 NEPP App Survey data we found that this explains much of why we see higher-than-normal levels of honey bee abundance in many orchards this year.
Exciting news for next years apple bloom! We are making some important changes to the Survey app and will be providing additional support both in the App and on the website. This year we learned how important it is to get GPS points and bee data when it is NOT cloudy. While bees can be active during partly cloudy weather, fully cloudy weather distorted accurate recording of lat/long coordinates, which limits data analyses on certain survey submissions. This update along with supportive hints and increased functionality of temp and GPS and auto-fill systems will ensure increased user friendliness.
Thanks for your efforts! Keep your antennae perked for our next blog about the recently launched and wisely developed New York State Pollinator Protection Plan.